This visual changed how I set goals
The diagram emerged organically, having no clue in that moment how much this visual would continue to guide me.
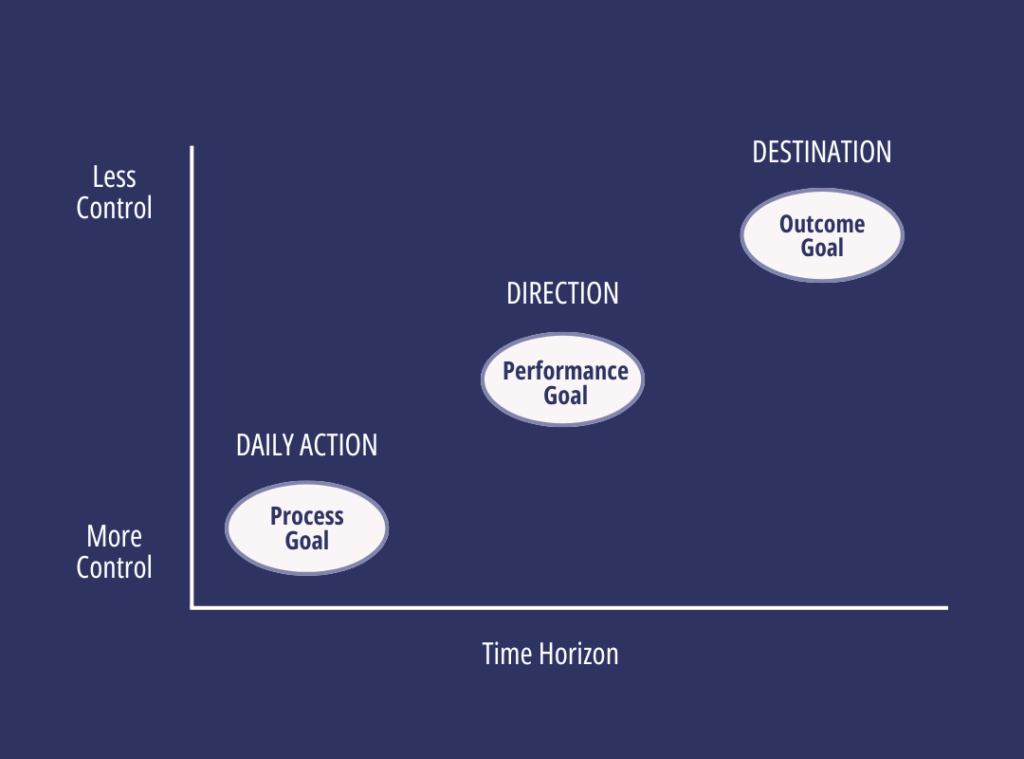
I had just joined a 12-week program to build my keynote speech, and I was reflecting on my professional goals. With the paper acting as a guide, I drew a simple graph with time along the bottom and control along the side.
Starting in the top right corner, I wrote my goal: 5-figure speaker.
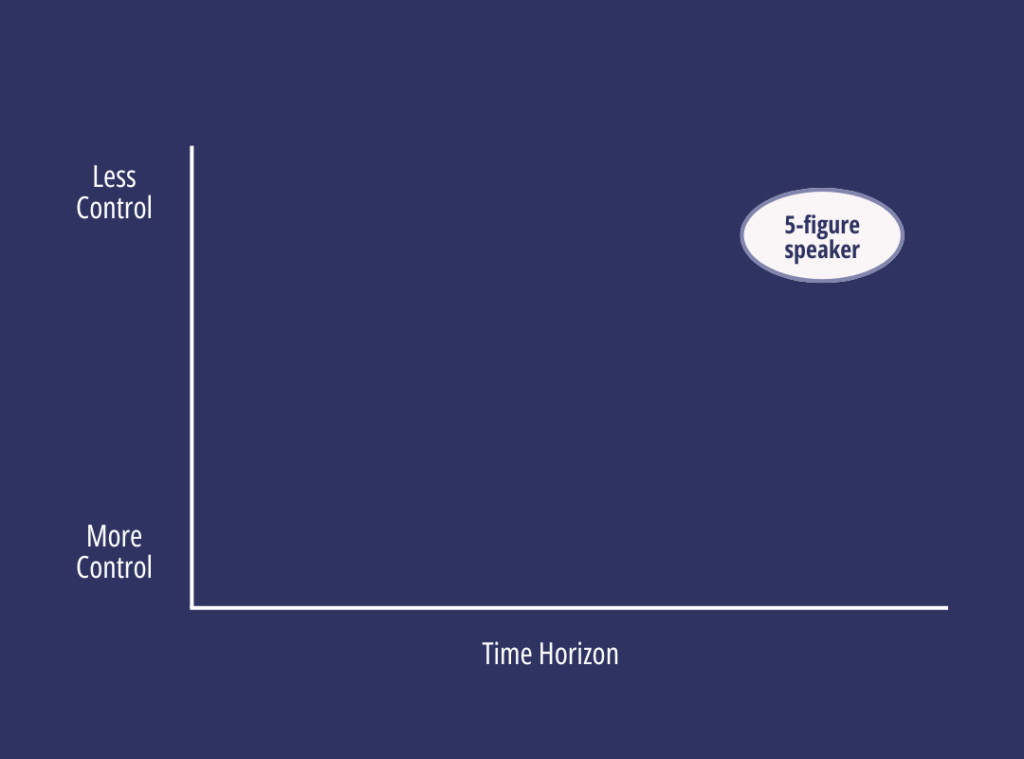
It’s the outcome I want, but as an outcome goal, it’s the furthest away on the time horizon and it’s an outcome over which I don’t have full control. Sure, I may be able to work hard and set my rates, but the decision to pay me for a speaking gig is up to someone else.
So next I moved to the middle of the graph to set the next goal: referable keynote.
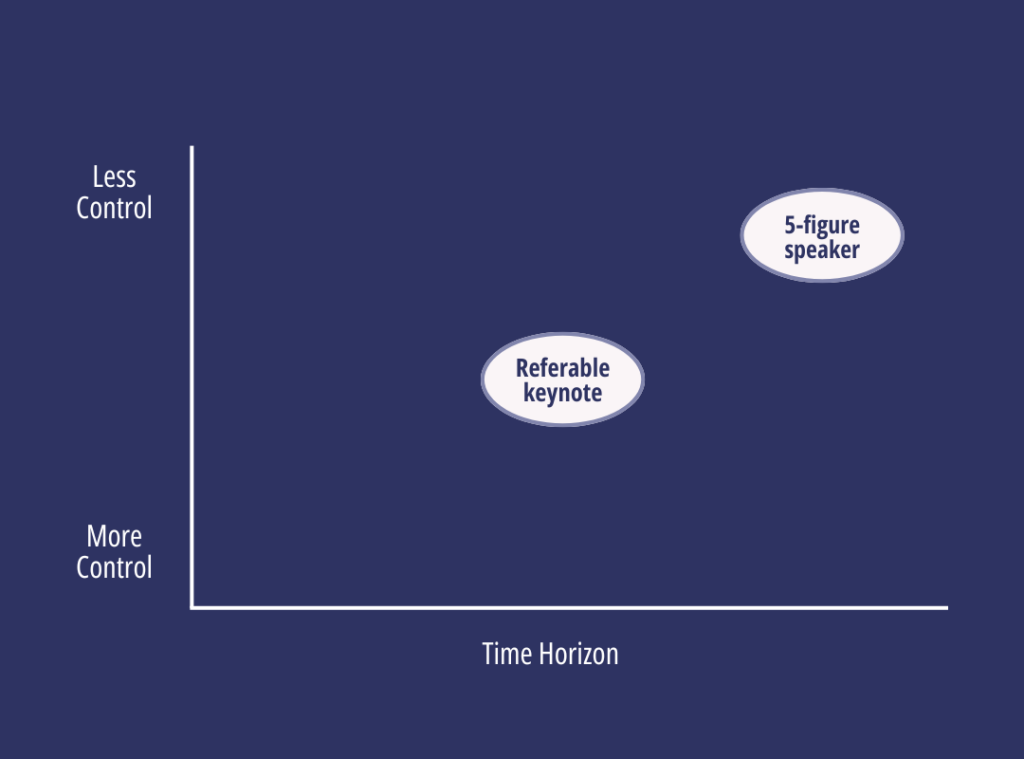
This one, a performance goal, is closer on the time horizon and more within my control. It’s about delivering a keynote talk worth booking. It’s the precursor to my outcome goal. If I want to be paid good money for speaking, I need to have a high-quality, well-delivered talk worth paying for.
So how do I get there? I moved to bottom left of my graph and wrote down the final goal: develop a keynote.
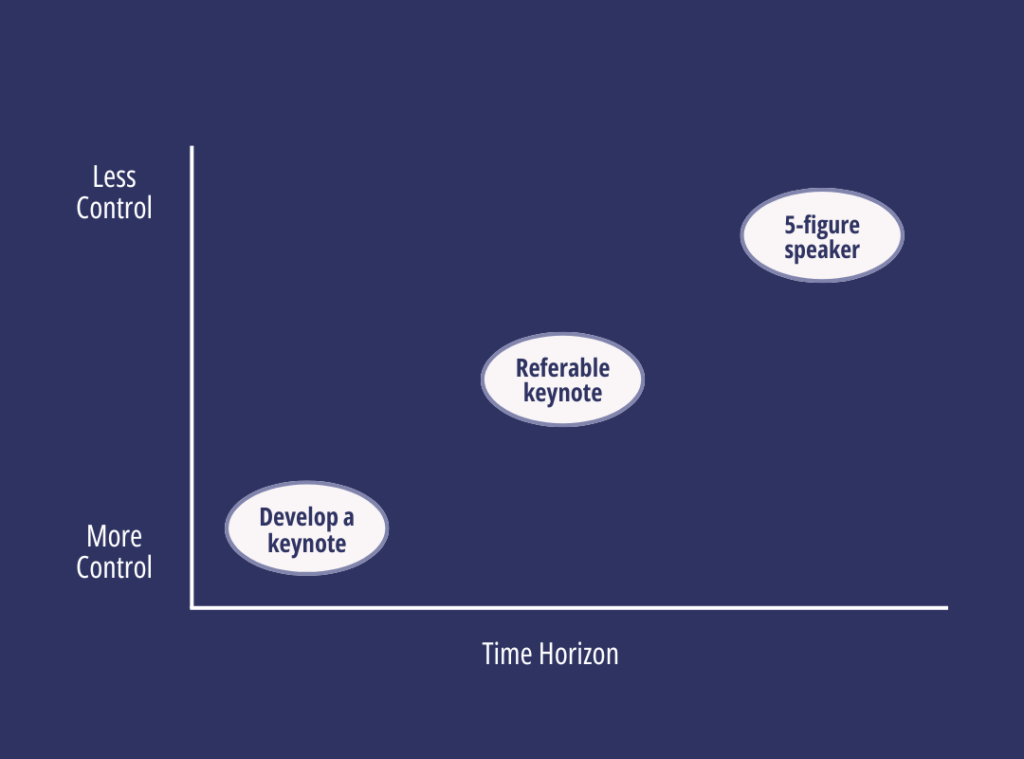
This goal, a process goal, is where the work happens. Not only does the work happen right away, it’s the effort over which I have the most control. It’s in part why I joined a 12-week program to keep me focused on the process week after week, getting valuable feedback along the way.
Goal mapping
Mapping my goals this way shifted my approach to goal-setting.
This visual provides an important perspective. It acts as a way to capture ambitious outcome goals while recognizing my focus needs to be on what I have the most control over: the process & my performance.
It’s about starting with the destination (outcome), setting the direction (performance), and identifying the required daily actions (process).
My 1M goal
Recently, I created a new map as I kick-off my goal to reach 1M people through speaking and writing. The target is the desired outcome but, most importantly, it sets a clear direction so I can work backwards to identify the performance I’m striving for, and the process required to improve my performance.
It’s why the public tracker I created doesn’t only include the total people reached, but it also tracks my process goals.
As Antoine de Saint-Exupéry once said, “A goal without a plan is just a wish.”
Interested in following along behind the scenes as I publicly work towards my goal? Join the newsletter to stay up-to-date and get practical tips on follow-through.